tools
csvview
Fast interactive CSV viewer for the terminal
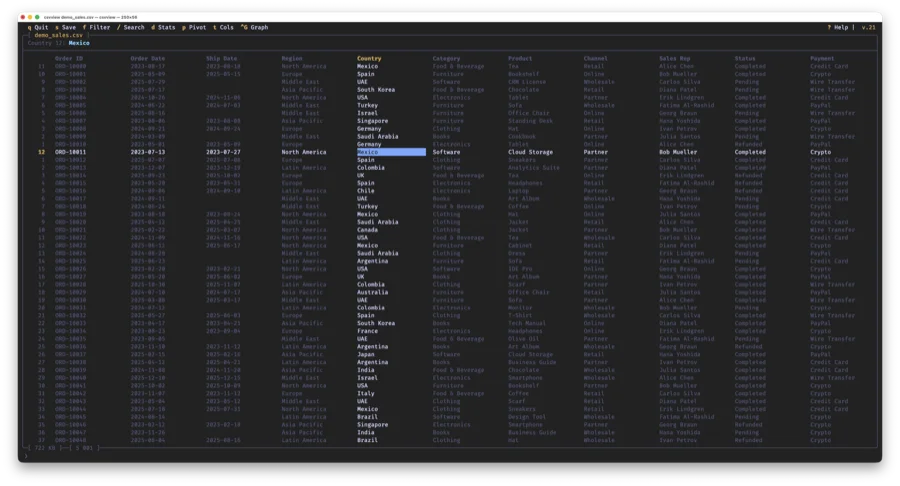
csvview is a TUI application for working with large CSV files, written in C using ncurses. No Python, no Electron, no dependencies — a single binary with instant startup and minimal memory usage. Works over SSH on any server.
Handles files with up to 50 million rows using memory-mapped I/O and multithreaded processing (up to 8 threads). Opens CSV, TSV, PSV, NDJSON with automatic delimiter detection.
Install
macOS via Homebrew:
$ brew tap daniil-khanin/csvview
$ brew install csvview
Or build from source:
$ git clone https://github.com/daniil-khanin/csvview.git
$ cd csvview && make
$ sudo make install # /usr/local/bin + man page
Quick start
$ csvview data.csv # open a CSV file
$ csvview data.tsv # TSV auto-detected
$ csvview --sep=\; data.csv # custom delimiter
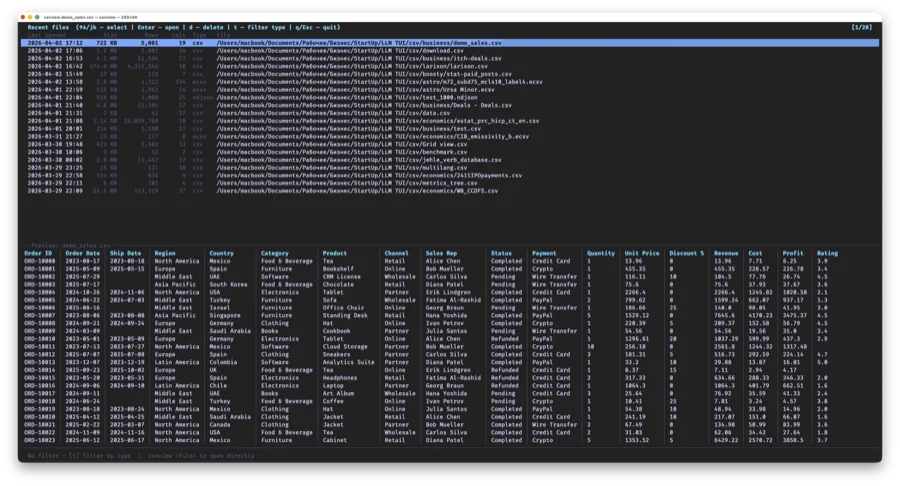
$ csvview # recent files picker
When launched without arguments, a recent files picker opens showing file size, row count, column count and file type.
Navigation
Move through the table with arrow keys or vim-style (h j k l). gg — jump to start, G — jump to end. Ctrl+G or :N — go to line by number. PageUp/PageDown for paging.
z — freeze columns on the left.
Navigation stays smooth even on multi-million-row files — data is read via mmap directly from disk without loading the entire file into memory.
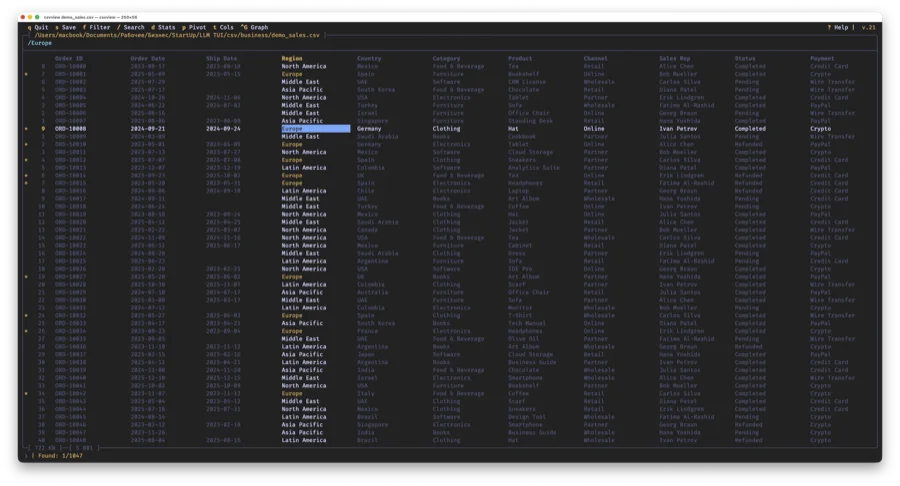
Search
Press / and type your search query. All matches are highlighted in the table and matching rows are marked with * in the gutter. n / N — jump to next/previous result.
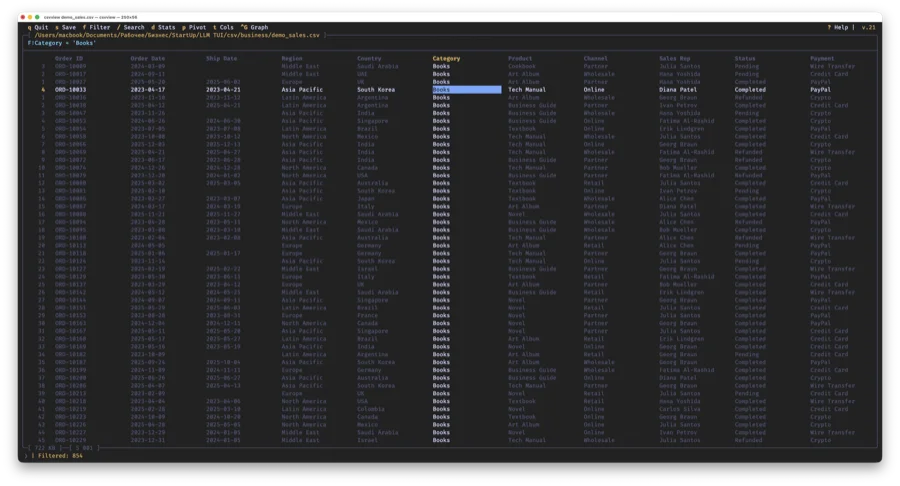
Filtering & sorting
f — quick filter on the current column. Shift+F — advanced filter with expressions:
revenue > 1000 AND status = paid
date >= 2025-Q1 AND date <= 2025-Q4
category != test OR priority = high
Supported operators: =, !=, >, >=, <, <=, logic: AND, OR, !. Dates can be filtered by month (= 2025-01) or
quarter (= 2025-Q3).
Sorting: [ — ascending, ] — descending. { / } — add a sort level for multi-level sorting.
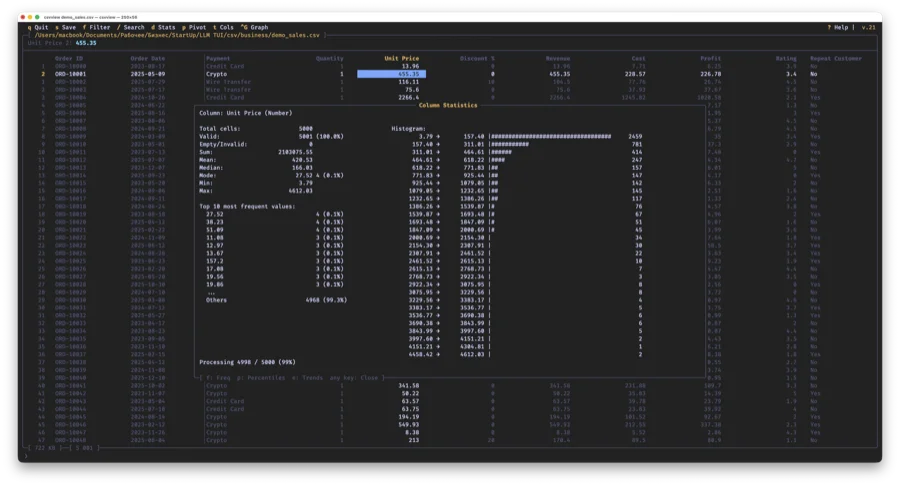
Column statistics
Press d on any column. For numeric columns: sum, mean, median, mode, min/max, top 10 values and a distribution histogram. For dates: breakdown by month, quarter, year.
Additional views: p — percentiles (P1–P99, IQR, stddev), e — trends (sparkline across 20 time buckets), f — full frequency list with navigation and drill-down.
Correlation matrix (:corr) shows Pearson r for all numeric columns with color coding. Press Enter on a cell to open a scatter plot of those two columns.
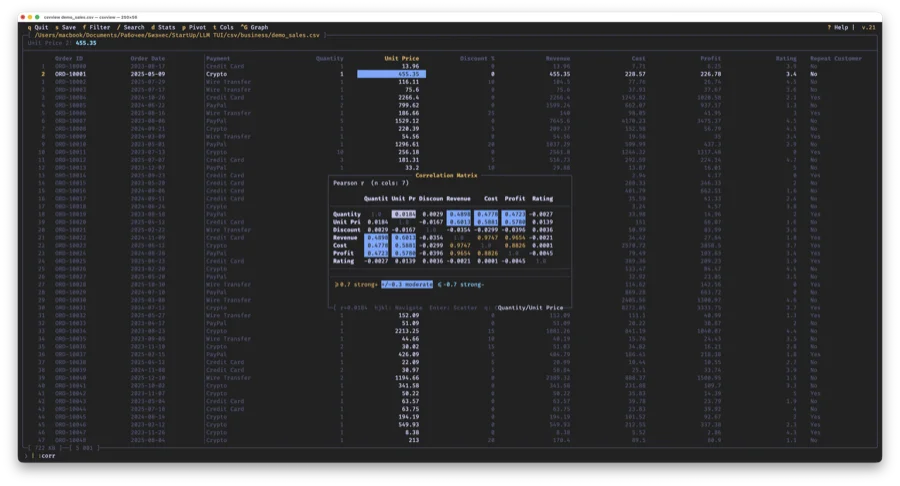
Outlier report (:outliers) finds rows where |z-score| exceeds a threshold. Enter — jump to row, f — apply filter.
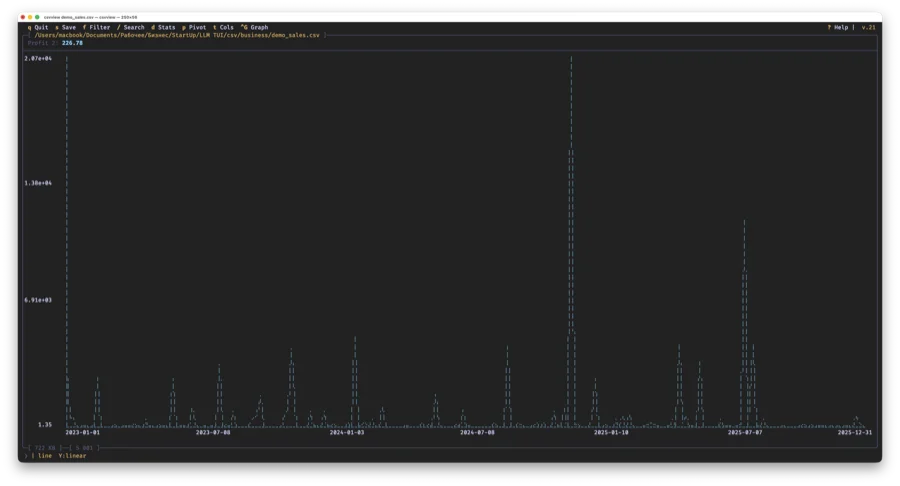
Charts
Press g on a numeric column to build a chart right in the terminal. Types: line, bar, dot. Charts are rendered using braille Unicode characters — each terminal character carries 2×4 pixels.
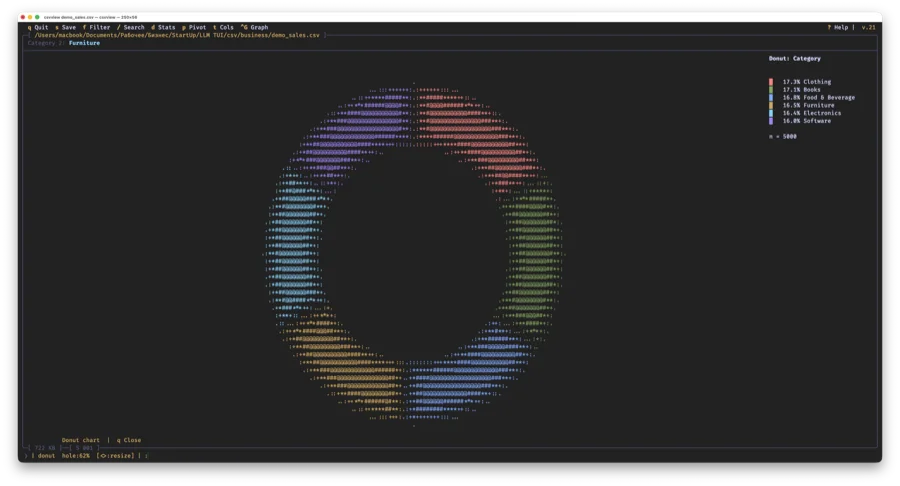
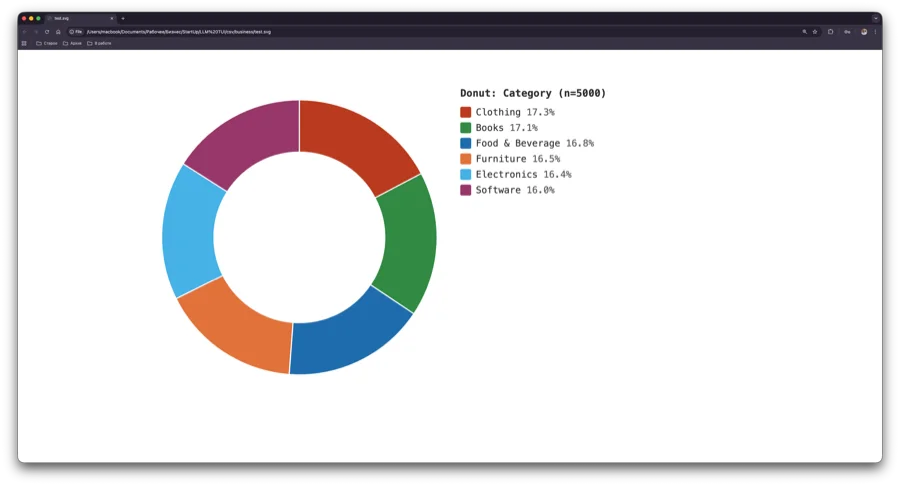
Scatter plot (:gsc) to visualize the relationship between two columns with Pearson r calculation. Dual Y axis (:g2y) to overlay two metrics with different scales. Donut chart (Ctrl+G on a text column)
for frequency distribution. Box plot (:gbox) to compare distributions.

All charts can be exported to SVG with :gsvg — a ready-made file for print or documentation.
Pivot tables
Press p to build a pivot table. In the settings window choose:
- Rows / Columns — columns for row and column grouping
- Values — column to aggregate
- Aggregation — SUM, AVG, COUNT, MIN, MAX, UNIQUE COUNT and combinations
- Date grouping — Month, Quarter, Year, Century (for date columns)
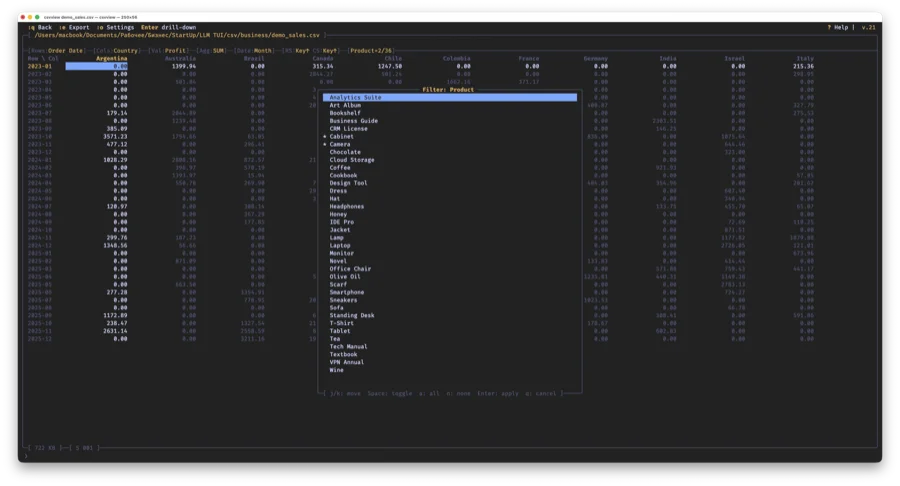
- Filter by — a 3rd dimension (Report Filter)
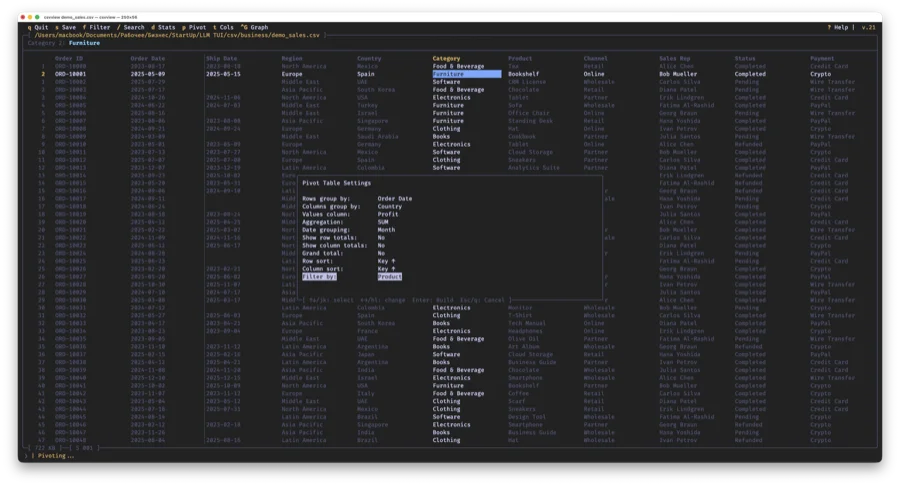
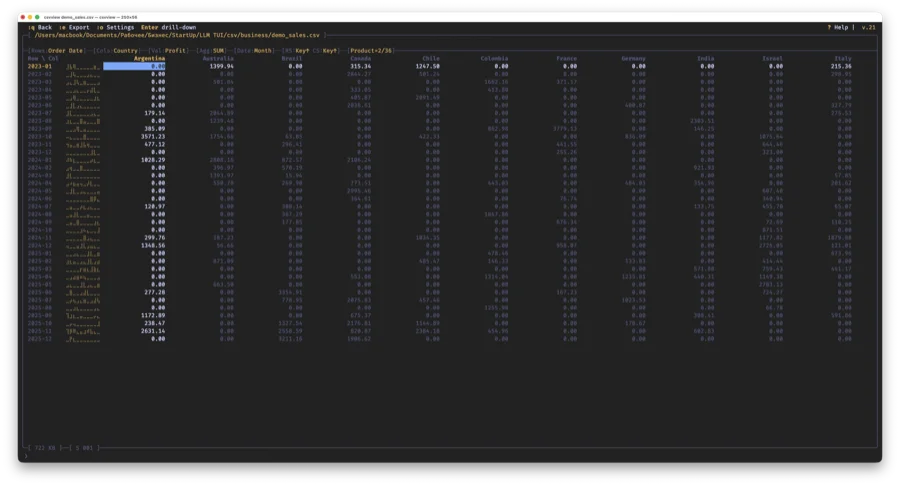
The result is an interactive pivot table with navigation, totals, and current cell highlighting:
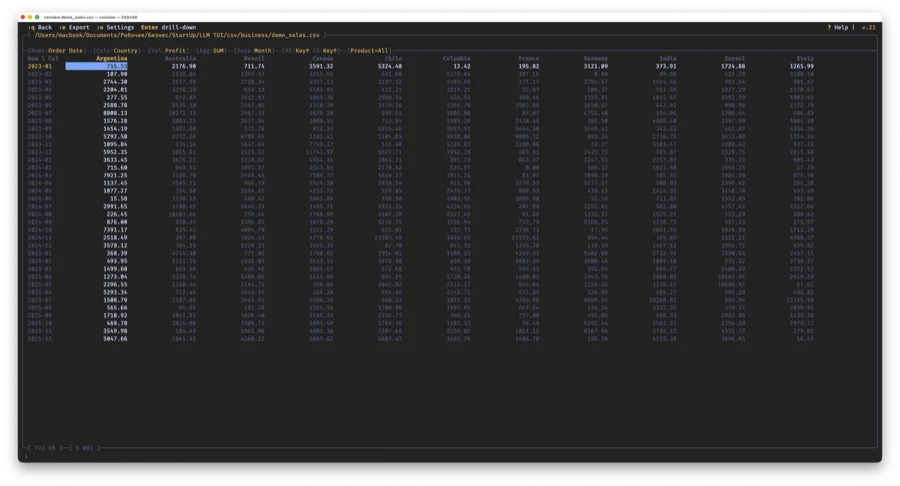
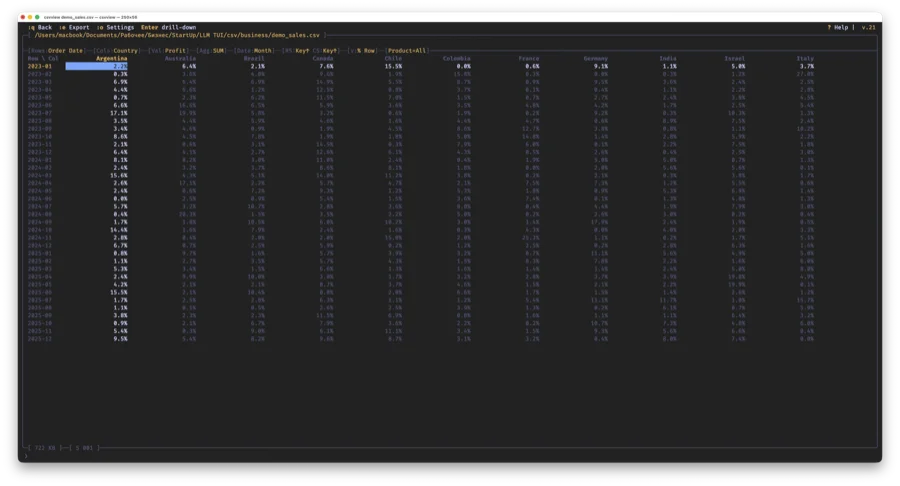
Show Values As (v) — switch display: absolute values → % of row → % of column → % of grand total → rank → running total.
Report Filter (F) — popup for selecting values of the 3rd dimension. * marks selected values, Space toggles. < / > — quick single-value cycling.
Sparklines (S) — braille trend chart next to each row. Transpose (T) — instantly swap rows and columns.
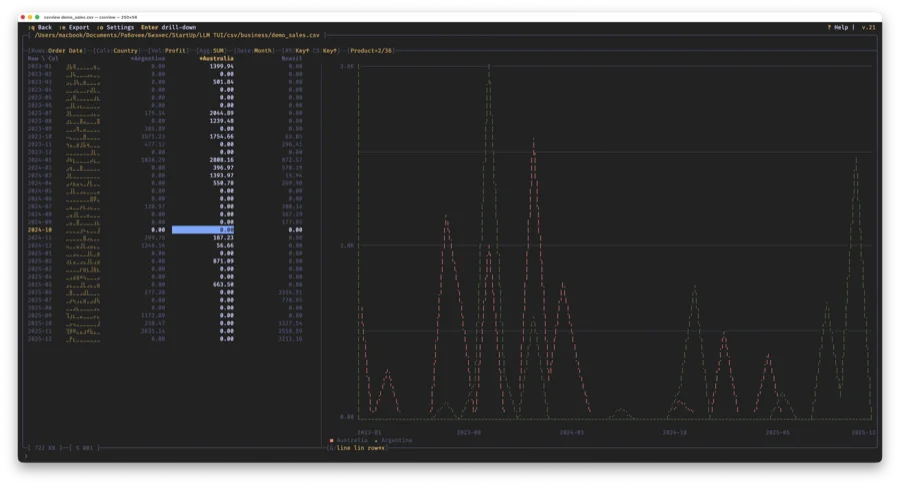
Graph (G) — split-screen: table on the left, chart on the right. Space — pin a series, a — toggle axis, s — linear/log scale.
Drill-down: press Enter on a pivot cell — the main table opens filtered by that cell's row and column values.
Export: :e — CSV, :em — Markdown, :eg — SVG chart. Pivot row filtering: :ptop 10, :pbot 5, :pfilter >1000.
Editing
Enter — edit a cell. u — undo (up to 20 steps). s — save changes to file.
Column management: :cr name — rename, :cd name — delete, :cal / :car name — add left/right, :dr N — delete row.
Computed columns (:cf) — add a column with a formula:
:cf profit = revenue - cost
:cf margin = round(profit / revenue * 100, 1)
:cf status = if(margin > 20, "good", "low")
:cf rank = rank(revenue)
Available functions: round, abs, floor, ceil, mod, pow, if, empty. Aggregates: col_sum, col_avg,
col_min, col_max, col_count, col_median, col_percentile, col_stddev, col_var, rank, pct.
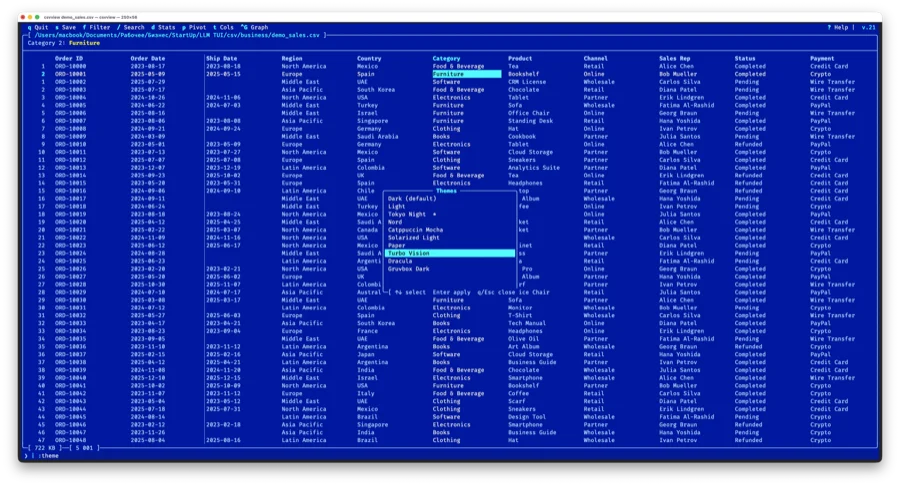
Themes
10 color themes: dark, light, tokyonight, nord, catppuccin, solarized_light, paper, turbovision, dracula, gruvbox. Pick with :theme (live preview) or from the command line with --theme=name.
CLI tools
csvview works not only as an interactive viewer but also as a set of CLI utilities:
$ csvview --cat a.csv b.csv      # concatenate CSV files
$ csvview --split --by=region f.csv # split by column value
$ csvview --profile data.csv     # data quality report
$ csvview --dedup data.csv       # remove duplicates
Open source, MIT license. Repository: github.com/daniil-khanin/csvview