tools
loOom
A graph explorer for structured data in the terminal
loOom is a TUI app that builds a knowledge graph from your CSV, ECSV, and Markdown files. Written in C with ncurses: a single binary, instant launch, works offline. Your data never leaves your machine.
You point it at your documents, loOom extracts entities (people, goals, teams, metrics) and automatically builds connections between them. Instead of reading dozens of files you see a map: who is connected to what, where data intersects, what dependency chains exist.
Installation
macOS (Intel + Apple Silicon):
Download loOom 0.8 for macOS$ tar xzf looom-0.8-macos.tar.gz$ cp looom-0.8-macos/looom /usr/local/bin/
Quick start
$ cd ~/Documents/my-data
$ looom
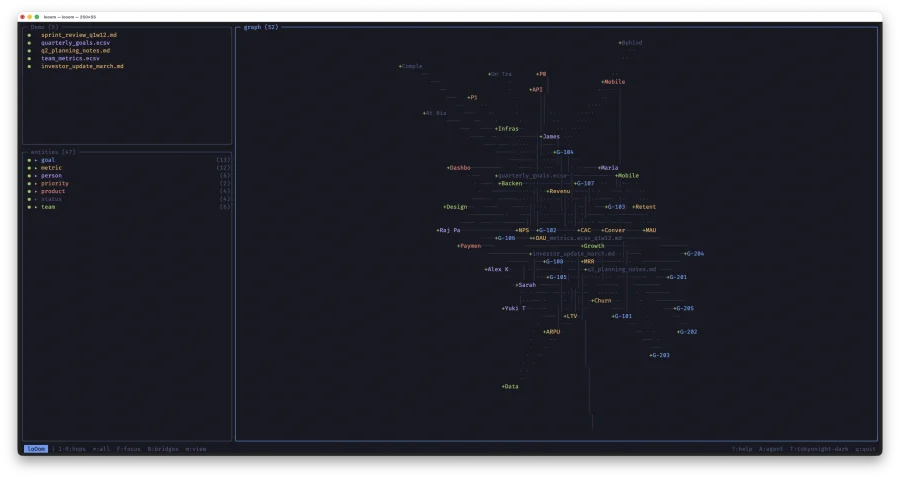
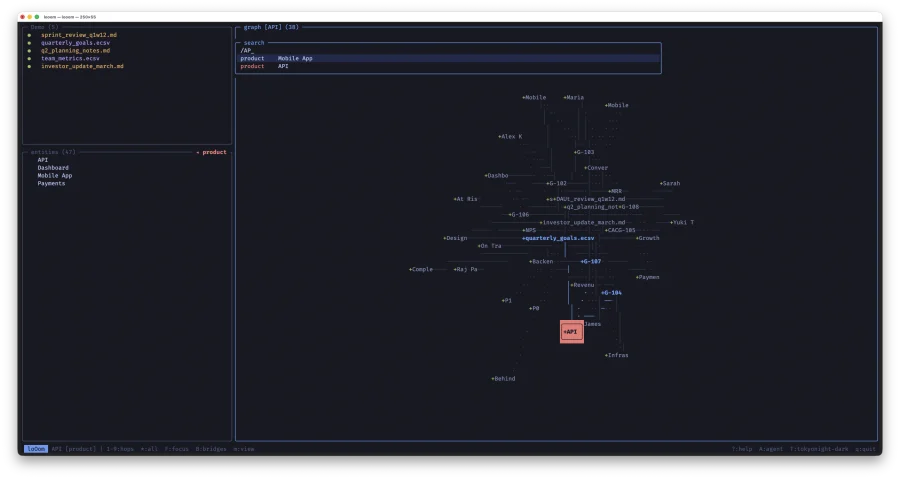
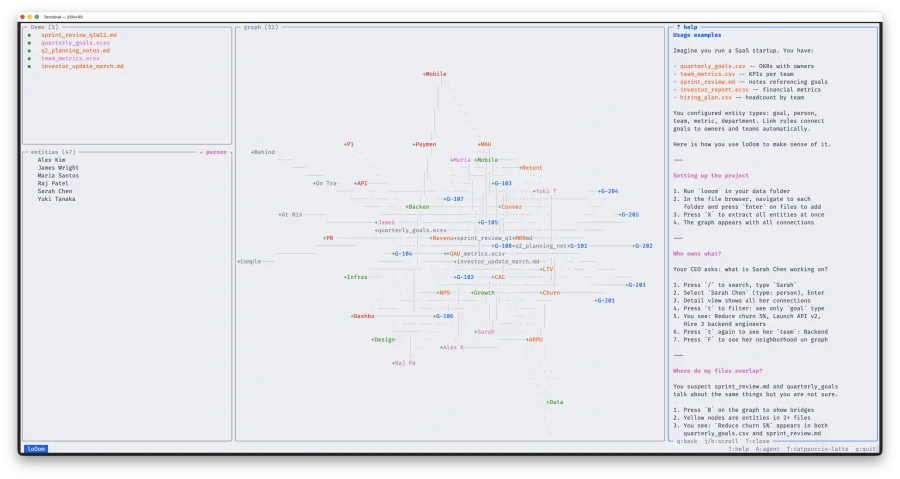
loOom opens in the current directory. The left side shows the file browser and entity list; the right side shows an interactive graph.
- Navigate to a folder with files, press
Enterto add them to the project - Press
Xto extract entities from all files - The graph is built — explore it
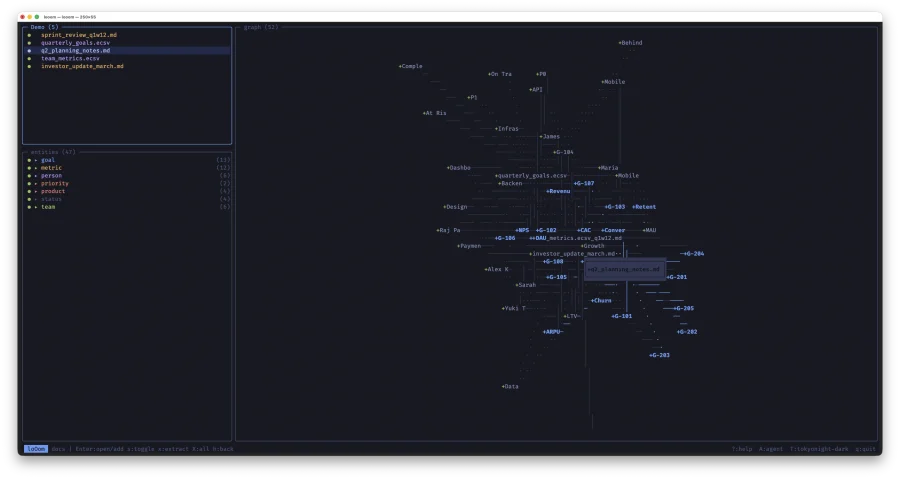
File browser
The upper-left panel provides file system navigation. Browse folders, add files, extract entities. Supported formats: CSV, ECSV, Markdown, XLSX.
Enteron a folder — open itEnteron a file — add to projects— show/hide file on graphx— extract entities from fileX— extract from all files at oncev— view Markdown with syntax highlighting
Three file states: ○ not added, ● added and visible, ◔ added but hidden on graph.
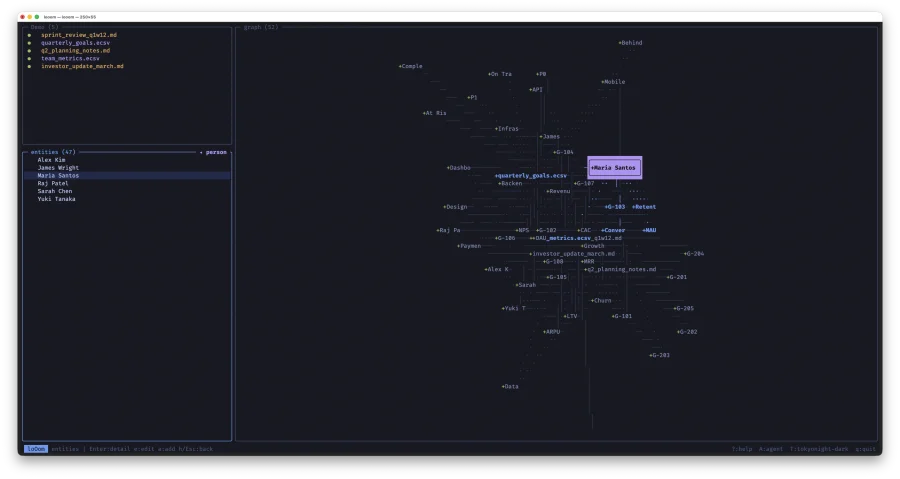
Entity tree
The lower-left panel lists all extracted entities grouped by type. First level shows types with counts, second level shows individual entities.
son a type — show/hide entire type on graphEnter— expand type or open entity detailF— focus graph on selected entity
Knowledge graph
An interactive force-directed graph of all entities and their connections. Vim-style navigation: h/j/k/l to move between nodes, H/J/K/L to pan, +/- to zoom, f for fullscreen.
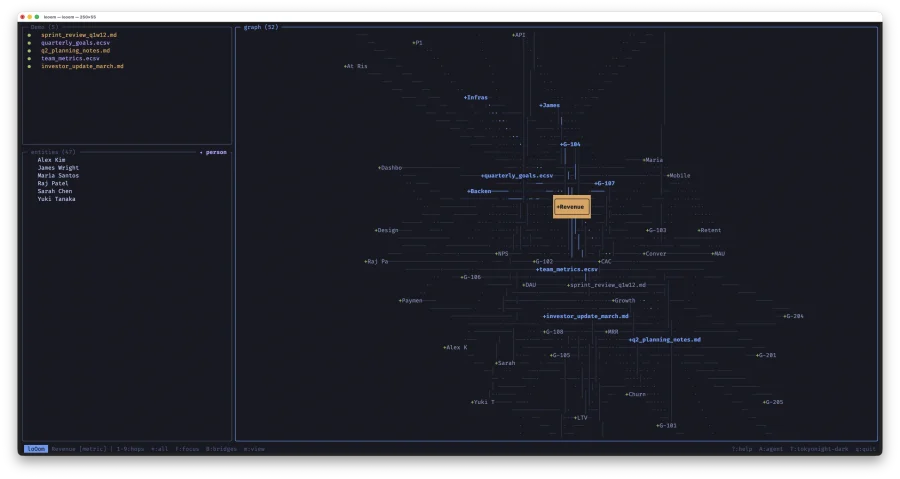
Two display modes
Press m to switch:
- All — files and entities with all connections
- Entities — entities only with semantic relations (no files, no contains/found_in)
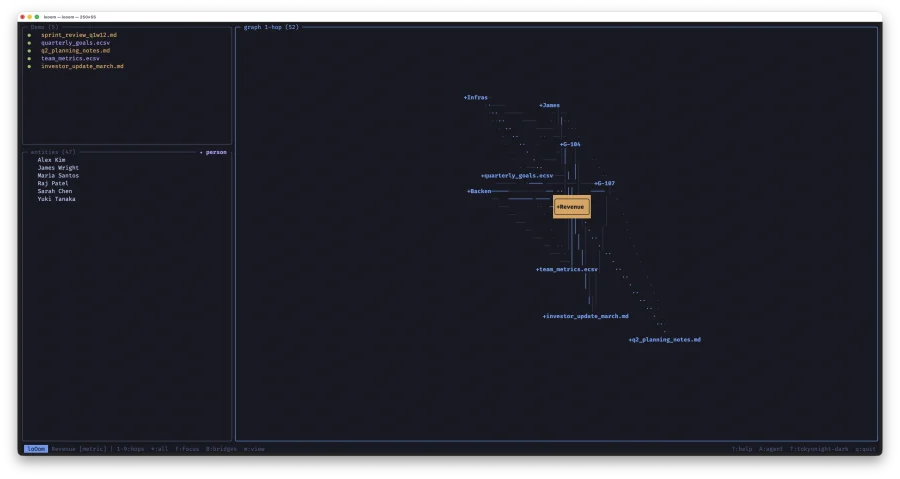
Hop depth
Press 1–9 to show only nodes within N hops of the selected node. * to show all. Instant switching with no graph recalculation.
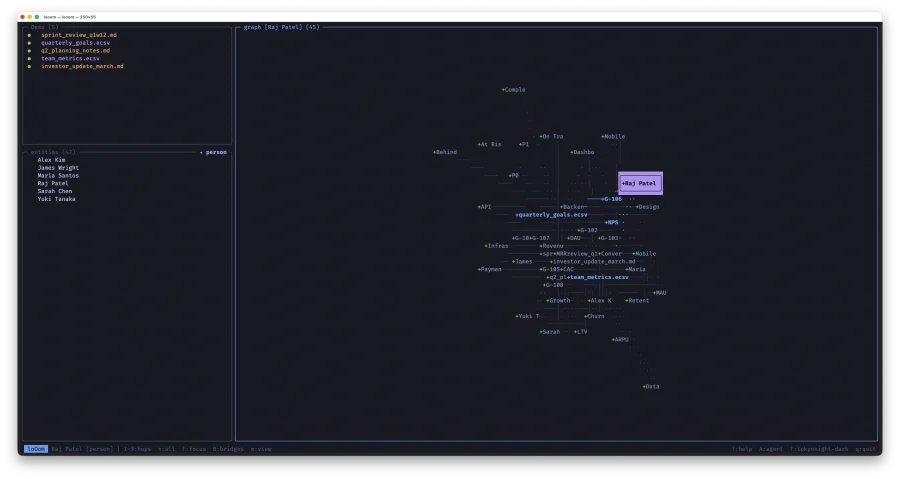
Focus
Press F on any node — the graph redraws showing only the 2-hop neighborhood. Instead of 1000+ nodes you see 10–30 relevant ones. The central node is drawn in a frame above the rest.
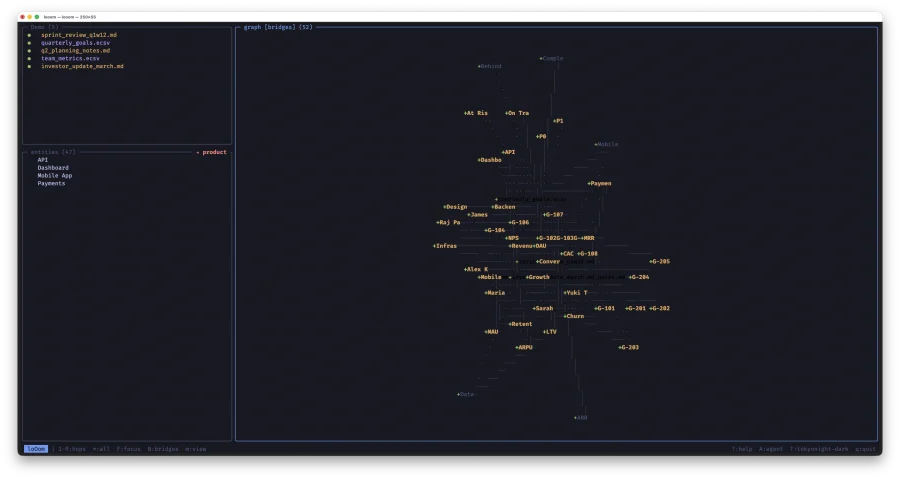
Bridges between files
Press B to highlight entities that appear in two or more files. These are the connection points between your disparate data. Yellow nodes are bridges; everything else fades out.
Search
Press / from any panel. Results filter in real time by entity name and type. Enter focuses the graph on the result and opens detail view.
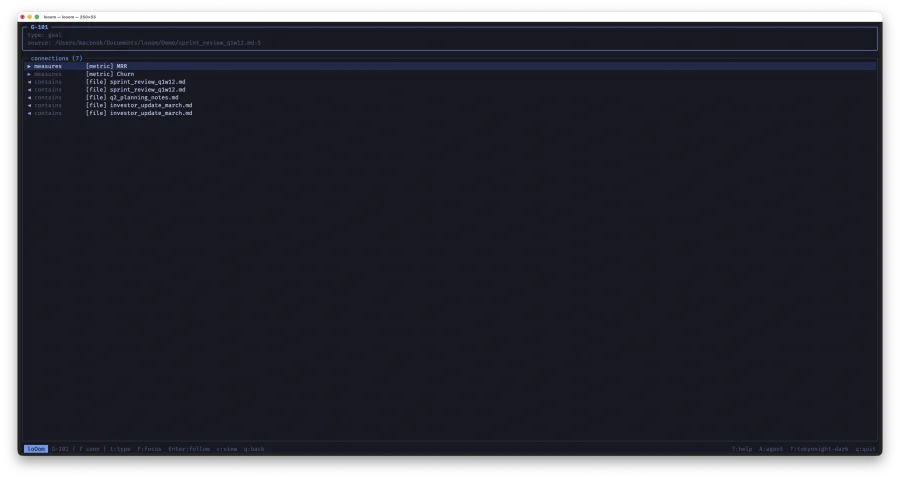
Detail view
Press Enter on an entity for a fullscreen view: type, name, source, attributes, and all connections (incoming and outgoing).
Filter by relation type
Press t to cycle through types: all → goal → person → team → metric → ... This lets you trace chains:
- Find person Sarah Chen →
t→ see her goals (G-101, G-105, G-108) Enteron G-101 →t→ see metric Churn and product PaymentsEnteron Churn →t→ see which files mention it
Entity extraction
loOom extracts entities using rules defined in .looom/entities.conf:
[goal]
description: Quarterly business goal
pattern: G-[0-9]+
color: accent

[person]
description: Team member or stakeholder
csv_column: Owner
csv_column: Lead
color: accent2

[metric]
description: Business KPI or metric
pattern: MRR|ARR|ARPU|CAC|LTV|NPS|DAU|MAU
csv_column: Metric
color: warning
Three extraction mechanisms:
pattern— regular expression (POSIX), searched in every line of the filecsv_column— CSV column name; unique values become entitiesecsv_header— field in ECSV comment headers
Link rules
The [links] section in entities.conf defines semantic relationships:
[links]
goal -> person: owned_by
goal -> team: assigned_to
goal -> metric: measures
goal -> product: targets
metric -> team: tracked_by
When entities of different types co-occur in the same CSV row, loOom automatically creates an edge between them. Flat tables become a knowledge graph.
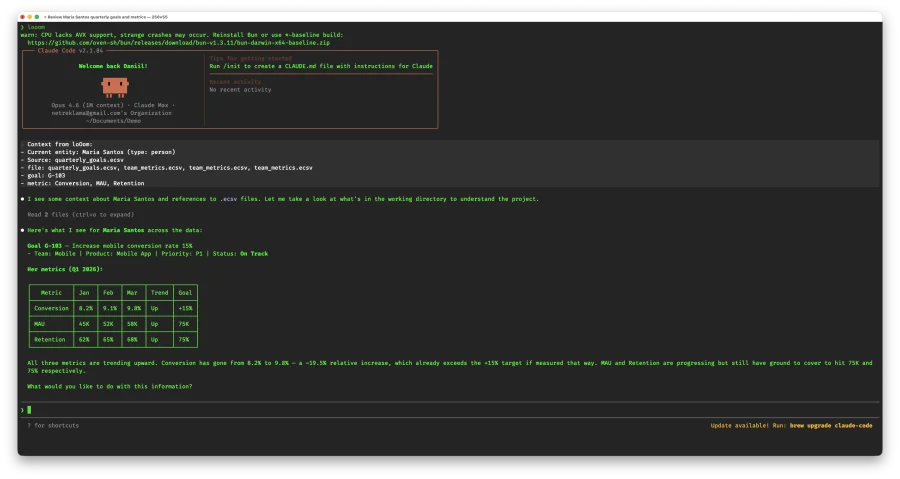
AI agent
Press A to launch Claude Code CLI directly from loOom. If an entity is selected, Claude receives its full context: name, type, all connections.
Context from loOom:
- Current entity: G-101 (type: goal)
- Source: quarterly_goals.ecsv
- person: Sarah Chen
- team: Growth
- metric: Churn
- product: Payments
Use it to analyze entities, generate type configurations from your data, create reports, find anomalies. Press ? → Setup Claude and loOom will create a CLAUDE.md with instructions for the agent.
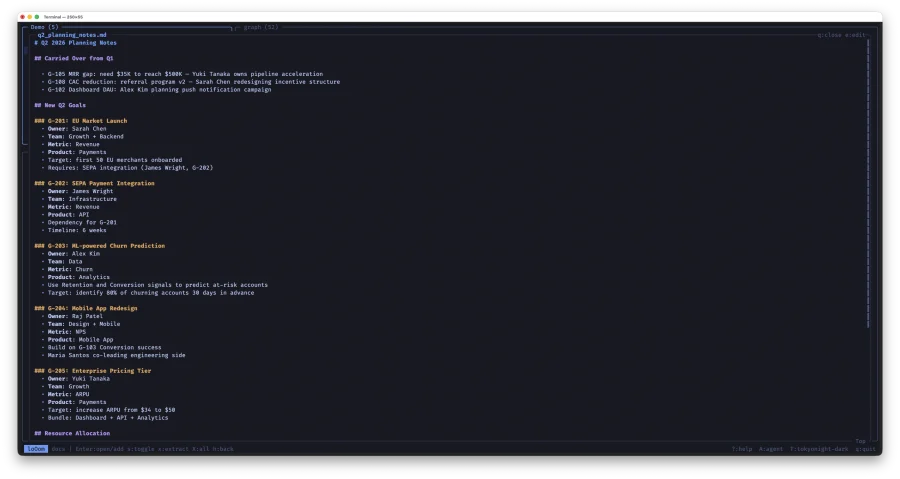
Markdown viewer
Press v on any .md file for a built-in viewer with highlighted headings, lists, blockquotes, code blocks, and tables. Works from the file browser, detail view, and column browser.
Themes
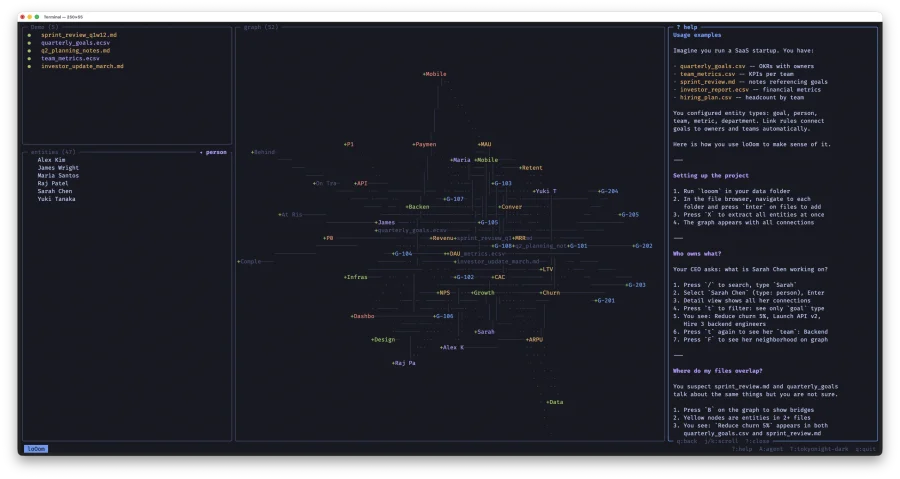
6 color themes: tokyonight-dark, tokyonight-light, nord-dark, nord-light, catppuccin-dark, catppuccin-light. Switch with T. All entity colors adapt automatically.
Help
Press ? to open the help panel on the right. It doesn't block your work — you can switch between panels freely. Sections: About, Hotkeys, Features, Usage examples, Prompts for Claude, Setup Claude, Activate License.
License and pricing
20€
One-time purchase. All updates within the major version included.
Trial: 2 days, up to 5 files and 50 entities. All features available.
License key is bound to your email and major version. Activate via ? → Activate License.
System requirements
- macOS 10.15+ (Catalina or later)
- Terminal with UTF-8 and true-color support
- Intel or Apple Silicon
Recommended tools
- vim — file editor (or set your $EDITOR)
- csvview — CSV/ECSV viewer for the terminal — github.com/daniil-khanin/csvview
- claude — AI agent —
npm install -g @anthropic-ai/claude-code
© 2026 Daniil Khanin. All rights reserved. daniil@khanin.info