What Unit Economics Tells Us
Podcast created by NotebookLM by Google
Very often, after filling out any unit economics table, you want to understand what this data gives you. What conclusions can we draw from this data? Let’s find out.
In fact, unit economics can provide deep insights into the state of your business, helping you identify problems and understand whether deeper attention is required.
For example, let's look at unit economics with the following parameters: UA = 15,000, C1 = 1.57%, AOV = 1400, COGS = 900, APC = 1.4, and LTC (same as CPA) = 13.
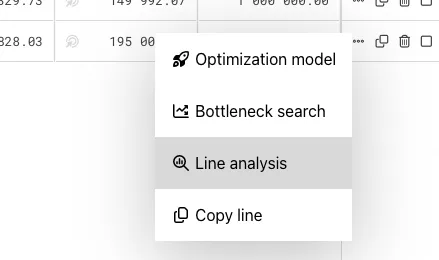
For the analysis, I’ll use the ueCalc service, which allows you to easily visualize your business model based on 20 parameters. Just enter your data into the free template "Basic Unit Economics Model" and generate the results. At the end of the row, click the “...” icon, and select “Analyze row” from the drop-down menu.
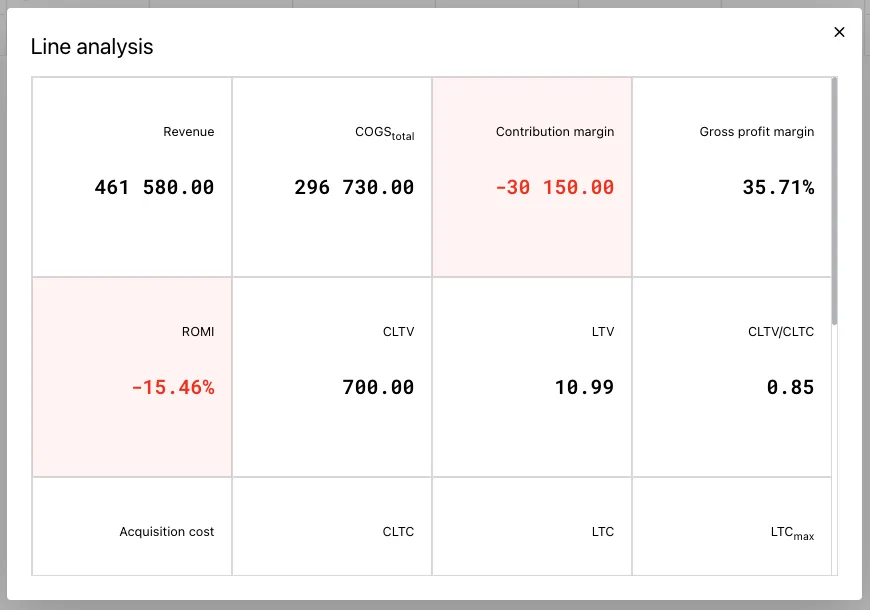
In the new window, you will get a full view of your business model.
Meaning of the Indicators
Let's break down what each indicator means:
Revenue — shows the total revenue generated by the cohort's customers over their lifetime with the unit economics you entered into the system. This is the sum of all transactions from all customers in the cohort.
COGStotal — shows the total cost of goods sold for all transactions from all customers over their lifetime.
Contribution Margin — shows the profit generated by all customers in the cohort from all transactions over their lifetime. A positive gross profit indicates that your unit economics is balanced, and with a large enough market, your business can become profitable.
Gross Profit Margin — shows how efficiently you make transactions and the share of COGS in the product or service's price. Formula: (AOV – COGS) / COGS.
ROMI — return on marketing investment, which shows how effectively you spend on marketing to attract new potential customers. Formula: (Revenue – Acquisition Cost) / Acquisition Cost.
CLTV — gross profit per customer over their lifetime. Formula: (AOV – COGS) × APC – 1sCOGS.
LTV — gross profit per potential customer. Formula: CLTV × C1.
CLTV to CLTC ratio — shows how profitable your marketing spend is on attracting customers. A value above 1 indicates profitability, while below 1 indicates losses. The higher the ratio, the more stable the business.
Acquisition Costs — the total amount spent on marketing to attract potential customers.
CLTC — cost to acquire one customer.
LTC — cost to acquire one potential customer.
LTCmax — maximum allowable cost per potential customer for the CLTV to CLTC ratio to be greater than 3.
Users Acquisition (UA) — the total number of potential customers.
Customers (C1) — the number of customers obtained from potential customers.
Transactions — the total number of transactions made by customers. Formula: B × APC or UA × C1 × APC.
First sale revenue — the average order value (AOV).
First sale CLTV — gross profit from the first transaction. Formula: (AOV – COGS) – 1sCOGS. If the profit is negative, the business depends on repeat purchases.
First sale Contribution Margin— shows if you recover customer acquisition costs from the first transaction.
First sale CLTV/CLTC — a relative indicator of the effectiveness of the first transaction compared to the customer acquisition cost.
As you can see, just a few unit economics parameters can provide a deep understanding of your business's state and its potential areas for improvement.
Unit economics & financial modeling in practice
50€/year
less than €1/week · billed annuallyPlus: theme customization, font settings, article printing and image zoom.
Subscribe to get access.
If you're already a customer, just log in.
we do not store your email, only the encrypted hash, which increases the security of your email.